Psychology
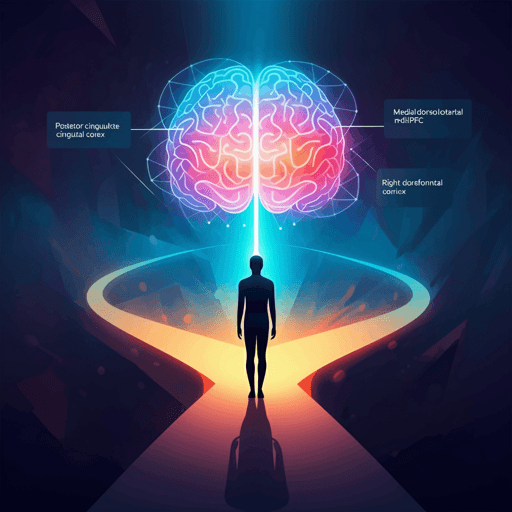
Decision-Making with Predictions of Others’ Likely and Unlikely Choices in the Human Brain
N. Ma, N. Harasawa, et al.
To predict others and make better value-based choices, humans rely mainly on a "primary" value difference from likely choices and sometimes a "secondary" difference from unlikely ones; fMRI and computational modeling reveal PCC and rdlPFC roles with mPFC integration—research was conducted by Authors present in <Authors> tag.
~3 min • Beginner • English
Introduction
The study examines how humans make value-based decisions when outcomes depend on another person’s choices that must be predicted beforehand. Prior work explored social cognition, theory of mind, and value-based frameworks, but the neural mechanisms for using multiple potential predictions (likely and unlikely choices by others) to guide one’s own decision remain unclear. The authors developed a task where participants’ rewards depended on another person’s choice; thus participants needed to predict others to determine their own effective reward magnitudes and then decide. The research aims to identify decision variables and brain regions encoding: predictions of others’ choices, value differences for self under likely and unlikely other-choice scenarios, and integration into final decisions.
Literature Review
The paper situates its work within social cognition and theory of mind (e.g., Schaafsma et al., 2015; Hackel and Amodio, 2018; Wu et al., 2020; Ho et al., 2022) and value-based decision-making frameworks (Lee, 2008; Rangel et al., 2008). It references learning about others’ preferences and recursive thinking (Behrens et al., 2009; Suzuki et al., 2012; Wittmann et al., 2016; Munuera et al., 2018; Hampton et al., 2008; Yoshida et al., 2008, 2010; Hula et al., 2018, 2021). The amygdala’s role in inferring others’ mental states and social computations is highlighted (Hutcherson et al., 2015; Gangopadhyay et al., 2021), along with frontal-parietal involvement in social decision-making (Ruff and Fehr, 2014; Yeshurun et al., 2021). The authors note additive vs multiplicative value formulations in tasks manipulating probability and magnitude separately (Rutledge et al., 2014; Blain and Rutledge, 2020).
Methodology
Participants: 62 healthy, right-handed adults (27 women; age 20–28, mean 21.3 ± 1.4). Exclusions: 8 for control-trial behavior criteria (models indicating reliance solely on Δp or Δm), and 6 for excessive head motion (>2 mm), yielding N=48 for behavior and fMRI analyses. Ethics: RIKEN Third Research Ethics Committee approval, informed consent.
Task: Three interleaved trial types: control-choice, control-prediction, and main trials (one-armed bandit with two options). Each option displayed: one orientation bar (encoding reward probability) and two numbers (reward magnitudes). Orientation-probability maps differed between self and other (five probabilities: 0.2, 0.35, 0.5, 0.65, 0.8; orientations sampled at 0°, 22.5°, 45°, 67.5°, orthogonal set at ±90° for max probability). In main trials, others’ choice determined which magnitude applied to self: bottom number for the option others chose; top number for the unchosen option. Control-choice trials: a color cue specified which magnitude color to use for self; reward outcome probabilistic per self map. Control-prediction trials: predict others’ choice using others’ probability map and top numbers; 30 points if prediction matched.
Trial phases: CUE (2–4 s), OPTION (3–6 s), CHOICE+INDICATE (≤4 s), FEEDBACK (2 s), ITI (2–4 s), with random jitters.
Stimulus generation: 10,000 candidate blocks (44 trials each) sampled, excluding identical orientations and equal probabilities for self or other; magnitudes sampled 1–99; color assignments randomized. Screening retained ~3,000 by distribution criteria (means/SDs within 90% confidence across candidates; normality by KS test), then 30 by correlation thresholds (<0.15 among specified pairs). For each participant, eight blocks randomly chosen: 2 control-prediction, 2 control-choice, 4 main; half for behavior, half for fMRI. Total per session: 44 control-choice, 44 control-prediction, 88 main (176 trials). Order randomized. Compensation: based on average points from 60 random trials, mean total ~9,000 ± 800 JPY.
Training: Practice control trials (5–10 each), learning session to predict partner’s choices (accuracy >85% over 50–100 trials), practice main trials (10–15), with comprehension checks.
Behavioral modeling: SoftMax choice probability q = 1/(1+exp(−DV)); DV is value difference (aligned to chosen option for fMRI). Model fitting via maximum likelihood (MATLAB mnrfit), comparing models with AIC.
Control trials models: Tested four DVs: βpΔp, βmΔm, βpΔp+βmΔm (additive), βmpΔ(mp). Group-level best models: control-choice best fit by additive βpΔp+βmΔm; control-prediction best fit by multiplicative βmpΔ(mp). d′ computed via signal detection theory.
Main trials behavioral analysis: Step 1 used best control models to compute others’ value difference ΔOV and self value differences conditional on others choosing left or right: ΔSV(O=L), ΔSV(O=R). Trials grouped by ΔOV to assess modulation of choices by appropriate ΔSV. Also decomposed into Δp and Δm(O=L)/Δm(O=R). Step 2 fitted three model assumptions:
- AI: uses primary prediction only: DV = βpΔp + βmΔm^p; others’ prediction via DV_o = βmpΔm_o^p.
- AII: uses primary and secondary when prediction is difficult: DV = βpΔp + βpmΔm^p + δx βsmΔm^s; δx indicates difficult trials based on |Δm_o^p| with grid search x ∈ {20,40,60,80,100}% of most difficult trials.
- AIII: does not use prediction: DV = βpΔp + βmoLΔm_oL + βmoRΔm_oR.
fMRI acquisition: 4 T MRI (Agilent), TEM volume transmit coil, 16-array head receive coil; visual via mirror/projector. EPI: 668 volumes/block; TR 1,076 ms; TE 20.5 ms; FA 64°; 25 axial slices (thickness 3.0 mm, gap 1 mm), FOV 192×192 mm, matrix 64×64, voxel 3×3×3 mm. Reconstruction via TGRAPPA (factor 2). Anatomical T1 MPRAGE high-res (1 mm iso) and low-res (1.72 mm iso). Physiological monitoring (respiration, cardiac) used for correction.
Preprocessing: AFNI and MATLAB; slice timing correction, removal of physiological signals, motion correction, spatial smoothing (Gaussian FWHM 6 mm), high-pass filtering, temporal normalization; sessions concatenated; anatomical normalization to Talairach; first-level analyses in native space then normalized.
GLM analyses: Model-based regressors derived from individual best behavioral fits. Three GLMs:
- GLM1: regressors for control-choice (Δp, Δm) and control-prediction (Δmp); main trial regressors per AI/AII/AIII selection (e.g., Δm_o^p, Δp, Δm^p; plus δ×Δm^s in AII; Δm_oL, Δm_oR in AIII).
- GLM2: four regressors: DVs for control-choice, control-prediction, DV_o (main), DV (main).
- GLM3: corresponding choice probabilities q for the four regressors.
Regressors convolved with canonical HRF over DECISION phase (OPTION onset to response), mean-corrected and normalized. Variant GLMs explored latency with five orthogonal HRFs delayed by 0–8 s.
Regressors of no interest: CUE and DECISION averages for each trial type (6), motor response (1), outcomes (2), motion parameters (12).
Group analysis: random-effects one-sample t tests; FWE correction via permutation (5,000 permutations, AlphaSim; cluster-defining threshold typically p<0.001). Contrasts via paired t tests within activated clusters.
Temporal dynamics: Basis functions with peaks −3 to 21 s (3 s steps), spline interpolation; nine parameters per variable; ROI time courses constructed around peak clusters (within 5 cm). Significance per time point via one-sample and independent t tests.
PPI analyses: ROI and voxel-wise PPI using DECISION phase as psychological seed (also tested others’ choice probability). Physiological seed from ROI BOLD time series deconvolved. Interaction term normalized, orthogonalized, HRF-convolved; included first-order and original GLM regressors. Voxel-wise PPIs reported with small-volume correction within target ROIs.
Individual differences: Examined rdlPFC activations for Δm^s across GI (AI best) and GII (AII best) subjects; correlations between rdlPFC effect sizes and behavioral preference (AIC AI vs AII), and between PPIs (amygdala→rdlPFC, PCC→rdlPFC) and behavioral indicators.
Key Findings
Behavioral results:
- Control-choice trials: additive value difference (Δp+Δm) best predicted choices (AIC 0.588 ± 0.194; predicted accuracy 89.8% [86.4, 92.0]); significantly better than Δmp (t(47)=5.521, p<0.001) and single-variable models.
- Control-prediction trials: multiplicative value difference (Δmp) best fit (AIC 0.568 ± 0.213; predicted accuracy 90.2% [87.4, 92.5]); significantly better than Δm and Δp; comparable to additive by AIC but superior by BIC.
- d′ for detecting higher values significantly >0 in both control trials (choice: t(47)=27.033, p<0.001; prediction: t(47)=33.665, p<0.001).
Main trials:
- Participants relied primarily on ΔSV corresponding to the likely other-choice (ΔOV>0: ΔSV(O=L) dominant; ΔOV<0: ΔSV(O=R) dominant), with no difference when ΔOV≈0. Differences confirmed by d′ comparisons (e.g., ΔOV>0: t(47)=8.525, p<0.001; ΔOV<0: t(47)=-6.954, p<0.001).
- Probability difference Δp contributed similarly across groups (no significant differences), while reward magnitude differences Δm(O=L) vs Δm(O=R) showed modulation by ΔOV (ΔOV>0: Δm(O=L) > Δm(O=R), t(47)=6.067, p<0.001; ΔOV<0: reversed, t(47)=-4.983, p<0.001).
- Primary (pASV) and secondary (sASV) value differences both influenced choices; sASV effect increased with prediction difficulty (one-way RM-ANOVA F(2,94)=9.61, p<0.001; Page trend p<0.001). Secondary reward magnitude difference Δm^s increased with difficulty (F(2,94)=5.351, p=0.006), significant in the top 10% most difficult trials (t(47)=2.547, p=0.014).
- Model comparison: AII (primary+secondary) fit better than AI (primary only) (paired t of AIC: t(47)=4.446, p<0.001), and both AI/AII better than AIII (no prediction) (I vs III: t(47)=-7.461, p<0.001; II vs III: t(47)=-8.688, p<0.001). Individually, 29 best fit by AII (GII), 14 by AI (GI), 5 by AIII.
fMRI results:
- Decision signals (chosen vs unchosen DV) in mPFC in both control-choice and main trials; no significant differences between trial types.
- Prediction signals: others’ choice probability significantly activated left amygdala in control-prediction and main trials (e.g., control-prediction: x=-30, y=-1.9, z=-13; main: x=-20.9, y=-2.7, z=-11; FWE-corrected p<0.05). Additional regions (insula, rTPJ, STG, IPL) in control-prediction.
- Main-trial specific valuation signals: PCC activation correlated with primary reward magnitude difference Δm^p (clusters in PCC/precuneus; FWE p<0.05). Right dorsolateral PFC (rdlPFC) activation correlated with secondary reward magnitude difference Δm^s (x≈46, y≈10, z≈35; FWE p<0.05); absent in GI controls.
- Δp associated activations in insula, MTG/STG/IPL across trial types; contrasts not positive for main>control-choice.
PPI connectivity:
- Left amygdala→PCC: positive connectivity during DECISION (ROI PPI t(47)=2.551, p=0.014; greater than control-prediction, t(47)=3.967, p<0.001).
- Left amygdala→rdlPFC: negative connectivity (ROI PPI t(47)=-4.508, p<0.001; more negative than control-prediction, t(47)=-6.968, p<0.001).
- PCC→mPFC and rdlPFC→mPFC: positive connectivity (PCC main>control-choice t(47)=3.955, p<0.001; rdlPFC main>control-choice t(47)=2.699, p=0.010).
- PCC↔rdlPFC: PCC→rdlPFC negative (t(47)=-4.137, p<0.001; more negative than control-choice), rdlPFC→PCC positive (t(47)=2.673, p=0.010; not different vs control-choice).
Temporal dynamics:
- Significant activation periods suggest three-stage processing: amygdala (prediction) earlier, PCC/rdlPFC (self magnitude differences) mid, mPFC (final decisions) later. GII showed earlier onsets than GI, consistent with additional processing for secondary valuations.
Individual differences:
- rdlPFC activation to Δm^s positively correlated with behavioral inclination to use secondary differences (Spearman r=0.337, N=43, p=0.028). In GII, negative amygdala→rdlPFC PPI correlated with behavior (ρ=0.400, N=29, p=0.033), and PCC→rdlPFC negative PPI correlated (ρ=0.433, N=29, p=0.020). Left amygdala activation for others’ choice probability negatively correlated with using Δm^s (ρ=-0.417, N=29, p=0.025).
Discussion
Findings establish that when individuals must decide under uncertainty about others’ actions, they compute and use multiple self-related valuation signals contingent on predicted likely and unlikely choices of others. Behaviorally, participants primarily used the value difference aligned with the likely other choice and recruited a secondary difference when prediction was difficult. Neurally, a network supports a three-stage process: left amygdala signals encode others’ choice probability (prediction), PCC encodes the primary reward magnitude difference for self (likely scenario), rdlPFC encodes the secondary difference (unlikely scenario), and mPFC integrates these for final choice. Functional connectivity patterns suggest amygdala signals modulate the balance between PCC and rdlPFC, enhancing reliance on primary differences when prediction is certain and permitting secondary contributions when uncertain. Temporal analyses are consistent with a cascade from prediction to valuation to decision integration. These results clarify differential roles of amygdala, PCC, rdlPFC, and mPFC in social decision-making with predictive components, and relate rdlPFC signals to individual variability in using secondary valuations, potentially connecting to executive control and social norm considerations.
Conclusion
The study identifies key computational variables and corresponding brain signals underlying social decision-making when one’s outcomes depend on predicted choices of others. It demonstrates a three-stage network: amygdala prediction signals, PCC and rdlPFC valuation signals for primary and secondary scenarios, and mPFC integration for final decisions. Behaviorally, most individuals use both primary and secondary valuation depending on prediction difficulty, with individual differences reflected in rdlPFC activations and connectivity. These insights advance understanding of social decision processes and suggest future work to examine broader social decision variables linked to rdlPFC, test causal roles (e.g., neuromodulation), integrate multivariate decoding methods, and extend to diverse social partners and contexts where probability and magnitude are independently manipulated.
Limitations
The analyses are correlational (univariate GLM and PPI) and cannot establish causality. Univariate methods may miss finer multivariate patterns; broader processes (e.g., salience, task readiness) may contribute. Interpretation of amygdala activity in terms of choice probability may overlap with general uncertainty or emotional salience accounts. BOLD temporal resolution limits definitive temporal ordering. The selection of “other” partners whose choices aligned with multiplicative value may constrain generalizability of prediction strategies. Model simplicity (linear probability and magnitude) was chosen for transparency; while alternative models were assessed, the chosen models may not capture all behavioral nuances.
Related Publications
Explore these studies to deepen your understanding of the subject.

