Earth SciencesNature
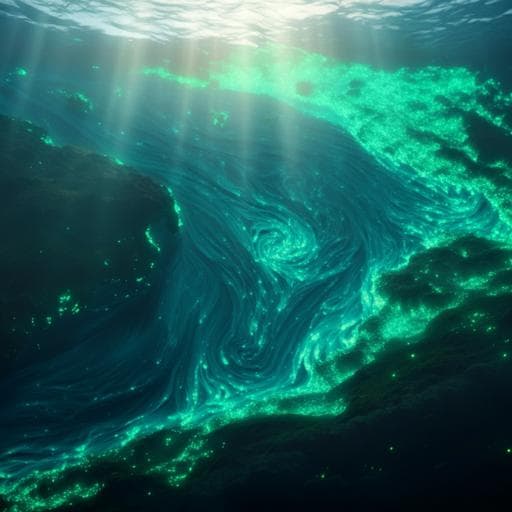
Coastal phytoplankton blooms expand and intensify in the 21st century
Y. Dai, S. Yang, et al.
This groundbreaking study, conducted by Yanhui Dai and colleagues, reveals a significant increase in the spatial extent and frequency of marine coastal algal blooms from 2003 to 2020, with intriguing variations in response to rising sea temperatures and ocean circulation patterns. Discover how these findings could influence global management and policy actions!
Related Publications
Explore these studies to deepen your understanding
Adjacent work that informs or extends this paper's methodology and findings.
Earth Sciences
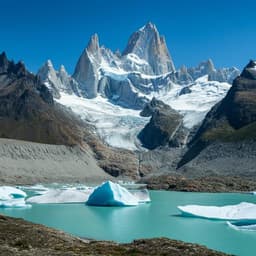
Rapid glacier retreat and downwasting throughout the European Alps in the early 21st century
C. Sommer, P. Malz, et al.

Environmental Studies and Forestry
Human expansion into Asian highlands in the 21st Century and its effects
C. Yang, H. Liu, et al.
Environmental Studies and Forestry
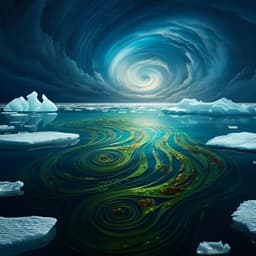
Climate change is associated with higher phytoplankton biomass and longer blooms in the West Antarctic Peninsula
A. Ferreira, C. R. B. Mendes, et al.
Environmental Studies and Forestry
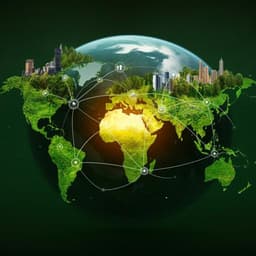
Projecting spatial interactions between global population and land use changes in the 21st century
D. Yang, W. Luan, et al.


