Environmental Studies and ForestryNature Sustainability
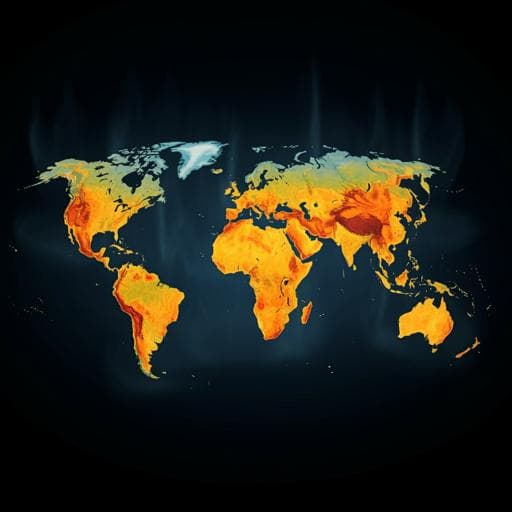
Change in cooling degree days with global mean temperature rise increasing from 1.5 °C to 2.0 °C
N. D. Miranda, J. Lizana, et al.
As global warming targets slip from reach, a new study reveals a staggering rise in cooling demands, especially in African nations. This vital research, led by experts including Nicole D. Miranda and Jesus Lizana from the University of Oxford, emphasizes the urgent need for immediate adaptation strategies.
Related Publications
Explore these studies to deepen your understanding
Adjacent work that informs or extends this paper's methodology and findings.

Environmental Studies and Forestry
Substantial decrease in CO2 emissions from Chinese inland waters due to global change
L. Ran, D. E. Butman, et al.

Environmental Studies and Forestry
"Maybe you need to do something about it": challenges in global environmental change research with and within local communities
R. Roos

Medicine and Health
Global, regional, and national burden of diabetes from 1990 to 2021, with projections of prevalence to 2050: a systematic analysis for the Global Burden of Disease Study 2021
G. 2. D. Collaborators, D. Kanyin, et al.

Medicine and Health
Nationwide trends in prevalence of underweight, overweight, and obesity among people with disabilities in South Korea from 2008 to 2017
D. Lee, S. Y. Kim, et al.


