
Medicine and Healthnpj Systems Biology and Applications
An integrated network representation of multiple cancer-specific data for graph-based machine learning
L. Pu, M. Singha, et al.
This innovative research conducted by Limeng Pu, Manali Singha, Hsiao-Chun Wu, Costas Busch, J. Ramanujam, and Michal Brylinski unveils a breakthrough in predicting cancer cell line responses to drug treatments using genomic data. By leveraging a unique graph reduction algorithm, the study enhances prediction accuracy through advanced feature representation, showcasing the power of non-Euclidean data in cancer pharmacotherapy.
Related Publications
Explore these studies to deepen your understanding
Adjacent work that informs or extends this paper's methodology and findings.
Medicine and Health
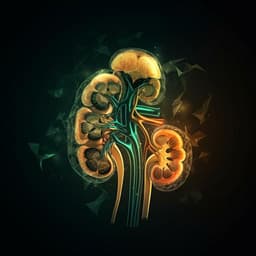
UroPredict: Machine learning model on real-world data for prediction of kidney cancer recurrence (UroCCR-120)
G. Margue, L. Ferrer, et al.

Computer Science
Reliability of Supervised Machine Learning Using Synthetic Data in Health Care: Model to Preserve Privacy for Data Sharing
D. Rankin, M. Black, et al.
Medicine and Health
Interpretable machine learning-based decision support for prediction of antibiotic resistance for complicated urinary tract infections
J. Yang, D. W. Eyre, et al.

Engineering and Technology
Machine Learning Techniques for the Performance Enhancement of Multiple Classifiers in the Detection of Cardiovascular Disease from PPG Signals
S. W. Rabkin, A. Cataldo, et al.


