logo
ResearchBunny Logo
Addressing gaps in data on drinking water quality through data integration and machine learning: evidence from Ethiopia

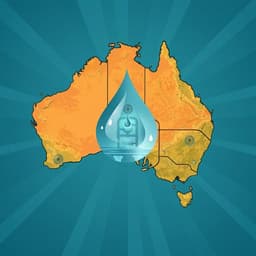
Environmental Studies and Forestry

Addressing gaps in data on drinking water quality through data integration and machine learning: evidence from Ethiopia

A. A. Ambel, R. Bain, et al.

This study, conducted by Alemayehu A. Ambel, Robert Bain, Tefera Bekele Degefu, Ayca Donmez, Richard Johnston, and Tom Slamyaker, tackles the pressing issue of poor drinking water quality data in Ethiopia. By employing advanced machine learning techniques on 2016 survey data, the research accurately predicts household water contamination, revealing potential pathways for improved public health initiatives.

00:00
00:00
~3 min • Beginner • English
Introduction
Safe drinking water is a critical human development priority and an SDG 6.1 target, yet many low- and middle-income countries lack safely managed services, with fecal contamination often the limiting factor. In 2020, about 26% of the global population (2 billion people) lacked safely managed drinking water services, and the burden of disease associated with unsafe water remains high. Household surveys in LMICs increasingly include E. coli testing to monitor water quality, but such modules are resource-intensive and not expected in every survey wave. This study investigates whether machine learning can predict E. coli contamination at the point of collection using variables commonly available in household surveys and geospatial datasets. Using Ethiopia’s 2015/16 ESS (wave 3) with measured E. coli, the study aims to: (i) predict contamination and compare performance across common classification algorithms; (ii) assess the contribution of water source type, household characteristics, and geospatial variables; and (iii) apply the best-performing model to ESS waves without water testing (2013/14 and 2018/19).
Literature Review
Prior applications of machine learning to LSMS-type survey data have addressed poverty, food security, crop mapping and yields, and fertilizer use. Water-quality related ML studies have predicted microbial contamination for specific systems (e.g., piped water in DRC) and aquifers (Uganda, Bangladesh), and produced predictive maps for chemical contaminants such as arsenic and fluoride. Other work modeled microbial contamination in surface and recreational waters. However, ML has not previously been used to predict drinking water quality from a nationally representative household survey nor to impute water quality for survey waves lacking direct testing. The study builds on this gap by leveraging survey-linked socioeconomic and geospatial variables to predict E. coli contamination in Ethiopia.
Methodology
Data source: Ethiopia Socioeconomic Survey (ESS) under LSMS-ISA. Waves: ESS2 (2013/14), ESS3 (2015/16; includes water quality module), ESS4 (2018/19; refreshed sample). ESS3 provided microbiological (E. coli) and selected chemical tests at point of collection; analysis focuses on predicting presence of E. coli (binary outcome: contaminated if ≥1 CFU per 100 mL). Features: Only variables commonly available across household surveys were considered, excluding water chemistry/physical parameters not consistently collected. Socioeconomic variables (e.g., wealth index constructed from assets, household characteristics), water service characteristics (harmonized water source categories), and geospatial variables derived from household location (rainfall, temperature, greenness, wetness, elevation, population density, distances to roads/markets, urban/rural). Data preparation: Constructed variables (wealth index; area-level open defecation share); harmonized water source categories (e.g., combined protected wells/springs/boreholes; combined unprotected wells/springs). Preprocessing included transformations, imputations, and dropping variables as needed. Dataset split 80/20 into training/test stratified by outcome prevalence. Feature selection via Boruta to reduce dimensionality (see Supplementary Table 1 for final features). Models: Evaluated GLM (logistic regression), GLMNET (elastic net), KNN, SVM (nonlinear kernel), Random Forest (RF), and XGBoost. Hyperparameters tuned by regular grid search to maximize ROC AUC. Evaluation: Given class imbalance (majority contaminated), metrics included accuracy, sensitivity (TPR), specificity (TNR), F1-score, and ROC AUC. Resampling (upsampling minority, downsampling majority) was tested; no significant improvement relative to main results (RF AUC ≈0.90 with resampling; XGBoost AUC 0.89–0.90). Software: R with relevant packages (glmnet, knn, kernlab, randomForest/gradient boosting implementations). Model scenarios: Tested five feature sets—All features; Water source only; Water source + household; Geospatial only; Geospatial + household—to assess contributions of variable groups. The best-performing model from ESS3 was applied to ESS2 and ESS4 to generate predicted contamination rates in waves lacking water testing.
Key Findings
Drinking water quality (ESS3): • 68% of households used improved sources; 32% used unimproved. • E. coli contamination detected in 84% (95% CI 82%, 87%) of households’ water sources; only 15.6% (n=864) were free of E. coli. • Among improved sources, 78% (95% CI 74%, 81%) of samples were contaminated. By improved subtype: piped on premises 56% contaminated; public taps 74%; protected springs/wells >89%. This confirms improved source type alone does not ensure safety. Algorithm performance (ESS3): • RF performed best across metrics: Accuracy 0.89 (95% CI 0.87, 0.91), F1 0.93, Sensitivity 0.95, Specificity 0.64, AUC 0.91 (95% CI 0.89, 0.94). XGBoost similar (Accuracy 0.88; AUC 0.90). GLM/GLMNET/KNN/SVM lagged. • Overall correct classification for full RF model: 88.4%, higher in rural (93.6%) than urban (77.8%). By source type, performance varied: e.g., truck/vendor 61% correct; rainwater and surface water 100% correct; protected and unprotected springs/wells ≥89% and ≥98% respectively. Variable importance (top predictors): • RF and XGBoost highlight annual rainfall, distance to nearest major market, average temperature, rural residence, water source categories (e.g., piped on premises, unprotected spring/well, surface water), distance to major road, area-level open defecation, average water spending, and potential wetness index as key predictors. Feature set scenarios (ESS3, RF): • All features: Accuracy 0.89; AUC 0.91. • Water source only: Accuracy 0.80; Sensitivity 1.00; Specificity 0.00; AUC 0.80—predicted all sources contaminated, performing poorly on specificity. • Geospatial only: Accuracy 0.88; AUC 0.91—comparable to full model. • Water source + household: Accuracy 0.85; AUC 0.89. • Geospatial + household: Accuracy 0.87; AUC 0.90. Cross-wave application: • Applying the ESS3-trained model to ESS2 (2013/14) and ESS4 (2018/19) produced predicted contamination shares broadly consistent with ESS3 actuals, with slight differences suggesting somewhat better access in 2015/16 than adjacent waves. Predictions by source type were generally within 95% CIs of ESS3 actuals for several categories (piped on-premises, rainwater, unprotected springs/wells, surface water).
Discussion
The study demonstrates that E. coli contamination at the point of collection can be reliably predicted using common household survey variables augmented with geospatial data. RF and XGBoost performed best, with RF achieving strong discrimination (AUC ~0.91) and high sensitivity, addressing the central question of whether machine learning can substitute for direct testing in survey waves without water quality modules. The strong performance of models using only geospatial or household variables suggests that, even without detailed water quality measurements or GPS in some surveys, risk estimation is feasible and can inform monitoring and policy. Variation in performance across source types (lower accuracy for piped and tanker/vendor supplies) indicates that management and operational factors, not captured in the available variables, influence water safety for these systems. Variable importance results underscore the relevance of environmental context (rainfall, temperature), accessibility/infrastructure (distance to markets/roads), sanitation environment (open defecation), and source type. The cross-wave applications illustrate the approach’s utility for tracking trends when direct measurements are unavailable, though validation is limited by lack of contemporaneous ground truth.
Conclusion
This work provides evidence that integrating socioeconomic and geospatial data with machine learning can effectively predict microbial drinking water contamination in a nationally representative survey context. RF models achieved high AUC and accuracy, and models using only geospatial or household variables approached the performance of full-feature models, indicating practical pathways to fill data gaps in survey waves lacking water quality testing. The approach can support national monitoring of safely managed drinking water and development of risk maps. Future research should: (i) incorporate temporal dynamics and seasonality; (ii) explore ensemble and alternative feature selection methods; (iii) include additional relevant variables (e.g., chlorine residual, system management indicators) where available; (iv) validate and transfer models to other countries’ surveys (e.g., MICS in Bangladesh, Nepal); and (v) assess performance for point-of-use contamination.
Limitations
Key limitations include: (1) E. coli is a snapshot measure and an imperfect proxy for fecal contamination, potentially missing pathogens like Cryptosporidium; (2) the water quality module was administered by separate teams, with discrepancies between water source types reported in the main survey vs. water testing visits, possibly due to seasonality or multiple-source use; (3) feature inclusion and geospatial dataset choices introduce subjectivity, and not all ESS variables were used; (4) models target point-of-collection contamination and may not generalize to point-of-use quality; (5) cross-wave applications lack contemporaneous ground truth for validation; and (6) potential temporal variations (e.g., seasonality) were not modeled explicitly.
Listen, Learn & Level Up
Over 10,000 hours of research content in 25+ fields, available in 12+ languages.
No more digging through PDFs, just hit play and absorb the world's latest research in your language, on your time.
listen to research audio papers with researchbunny