
Computer ScienceNature Communications
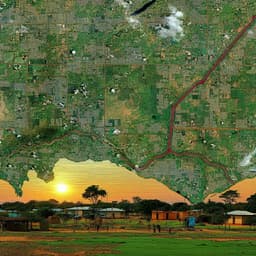
A human-machine collaborative approach measures economic development using satellite imagery
D. Ahn, J. Yang, et al.
This groundbreaking study by Donghyun Ahn and team reveals how machine learning analyzed satellite imagery can unveil economic development indicators, even in data-scarce regions. The model provides insights into North Korea's economic landscape, emphasizing potential for sustainable growth without needing ground-truth data.
Related Publications
Explore these studies to deepen your understanding
Adjacent work that informs or extends this paper's methodology and findings.

Tourism
Sustainable rural development in Northwest Iran: proposing a wellness-based tourism pattern using a structural equation modeling approach
H. Esfandyari, S. Choobchian, et al.
Economics
Using publicly available satellite imagery and deep learning to understand economic well-being in Africa
C. Yeh, A. Perez, et al.

Earth Sciences
Automatic detection of methane emissions in multispectral satellite imagery using a vision transformer
B. Rouet-leduc and C. Hulbert

Engineering and Technology
All-printed nanomembrane wireless bioelectronics using a biocompatible solderable graphene for multimodal human-machine interfaces
Y. Kwon, Y. Kim, et al.


